By Aileen Buckley and Jaynya Richards, Esri Research Cartographers, and Michael Wilburn, Esri Ocean Basemap Cartographer
 Esri released its beautiful Ocean Basemap in June 2011. Some of you have been asking for a style that contains the colors used to symbolize the bathymetry in that basemap. Now you can download the Ocean Basemap color style, which contains the colors used to display the bathymetry in the Esri Ocean Basemap.
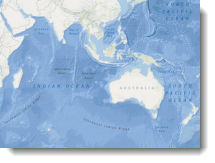
The colors in the style were used for the bathymetric layer tint at small and medium map scales (figure 1). Small map scales range from about 1:593 million to about 1:2 million, and medium map scales range from about 1:1 million to about 1:72 thousand.
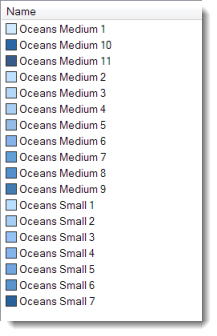
Figure 1. The colors in the style were used to render the Ocean Basemap bathymetry at small and medium map scales.
These colors will appear in the color palette when you reference the Ocean Basemap color style (figure 2).
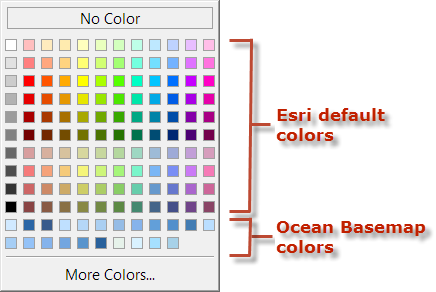
Figure 2. The colors in the referenced style are displayed in the color palette.
The Ocean Basemap was symbolized using these colors and the Classified renderer in ArcMap. The class breaks are shown below in figure 3, along with the colors in the style that were assigned to the classes.
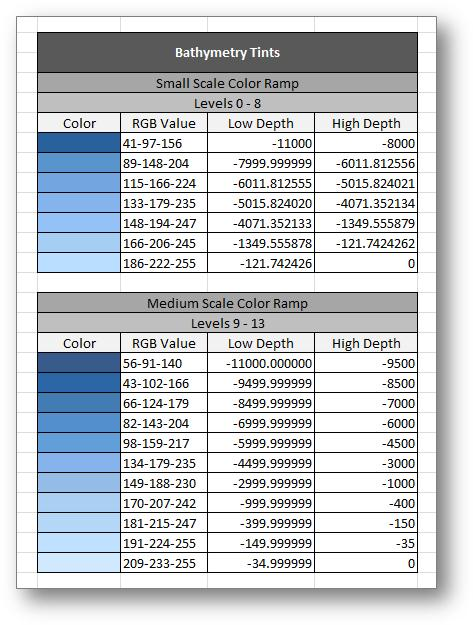
Figure 3. The class breaks and related colors were used with the Classified renderer to create the Ocean Basemap.
You can use the colors in the style and the breaks above to symbolize data in your map using the Classified renderer (figure 4).
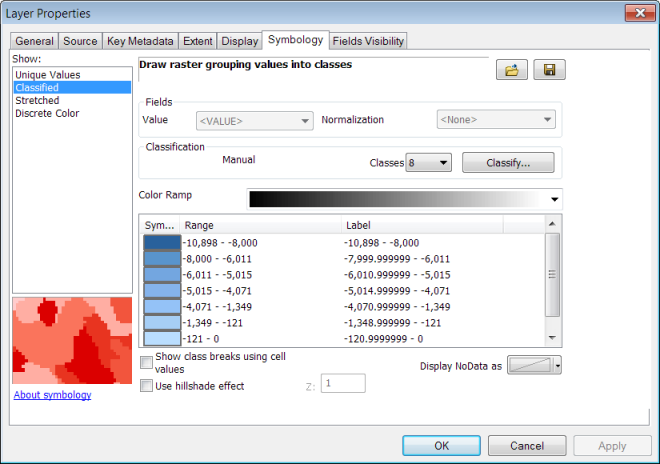
Figure 4. The Classified renderer can be used with the colors and class breaks shown in figure 3.
The result will look similar to the Esri Ocean Basemap, although the map in figure 5 is shown without the hillshade or labels.
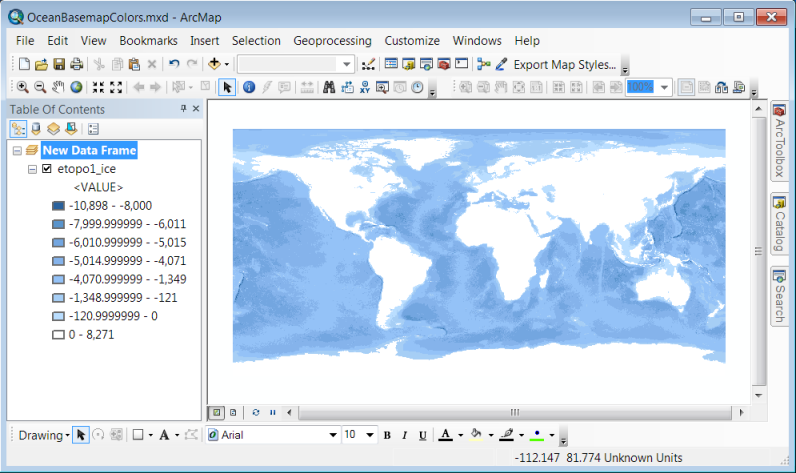
Figure 5. The result of using the Classified renderer and the colors/breaks in figure 3 is shown above.
The Ocean Basemap color style also contains color ramps that were created with the colors used to symbolize the Ocean Basemap bathymetry (figure 6). There are two color ramps, one with the colors used for the smaller map scales and one for the medium map scales.
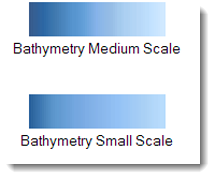
Figure 6. The two color ramps that are included in the download were created with the colors used to symbolize the bathymetric layer tint in the Esri Ocean Basemap.
The color ramps in the style can be used to symbolize data using the Stretched
renderer (figure 7). A Minimum-Maximum stretch can be used to set the minimum value to zero, thus rendering the areas above land in white.
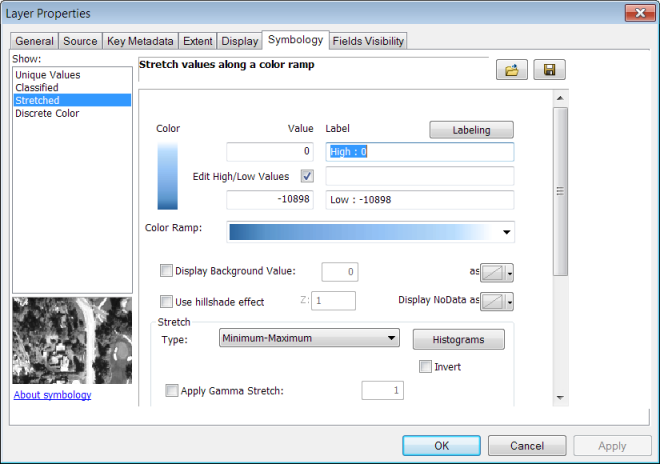
Figure 7. The Stretched renderer can be used with the color ramps.
The result will look a little different from the Esri Ocean basemap because the colors are not assigned to exactly the same elevation ranges (figure 8) as with the Classified renderer. Nonetheless, for some applications, these color ramps may prove useful to you.
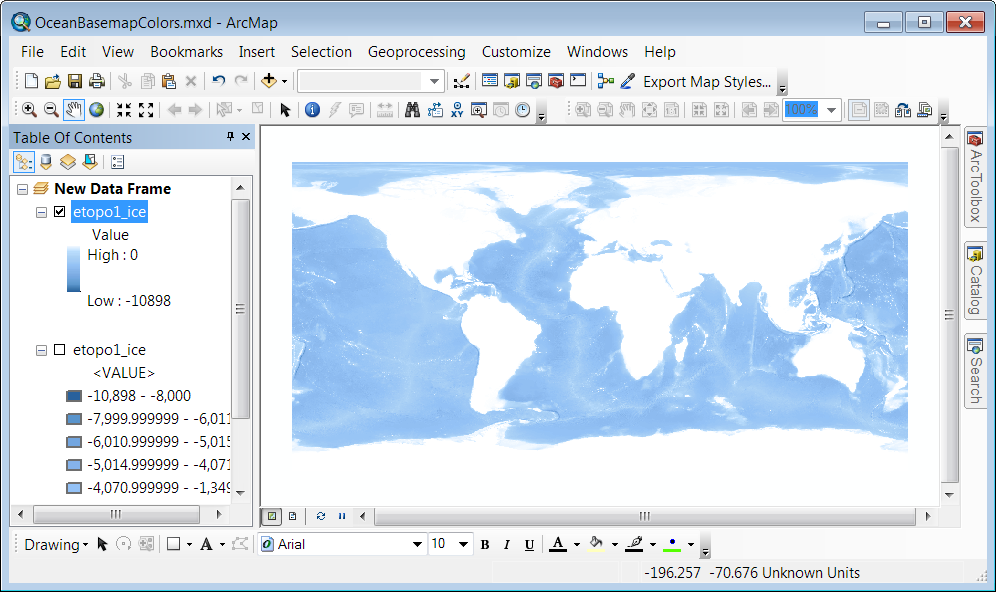
Figure 8. The result of using the Stretched renderer and the Bathymetry Small Scale color ramp.
Download the Ocean Basemap color style now to create your own great bathymetric maps with ArcMap!